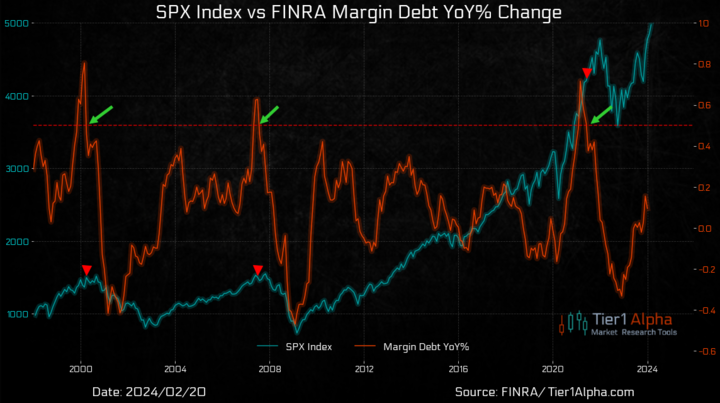
SPX Index vs FINRA Margin Debt YoY% Change

Margin leverage represents the funds borrowed by investors from their brokerage through a margin account. This financial strategy enhances potential returns, as it allows investors to command a larger position in a stock than their capital alone would permit, thereby intensifying profits (and losses).
The latest figures from FINRA show that margin debt has continued its growth trajectory for the third consecutive month, reaching $701.98 billion. When observed on a month-over-month basis, the debt has increased slightly by 0.2% and significantly by 9.5% from the previous year. Yet, when we adjust for inflation, the growth narrative adjusts, showing a 0.4% month-over-month decrease but a 6.2% annual increase.
Although this data is typically two weeks old upon release, historical patterns suggest margin debt levels can provide foresight into market movements. For instance, the substantial rise in leverage in late 1999 culminated in March 2000, aligning with an interim daily peak of the S&P 500, even though the index reached its peak monthly close later in August. A similar pattern emerged in 2006, with the peak in leverage occurring in July 2007, a few months before the market peak. A significant trough was noted in February 2009, coinciding with the market bottom, followed by a notable uptrend. More recently, a surge post-COVID peaked in October 2021, preceding the market’s all-time high by two months. Margin debt is not cratering but is increasing at a much slower rate and decreasing MoM when adjusted for inflation.
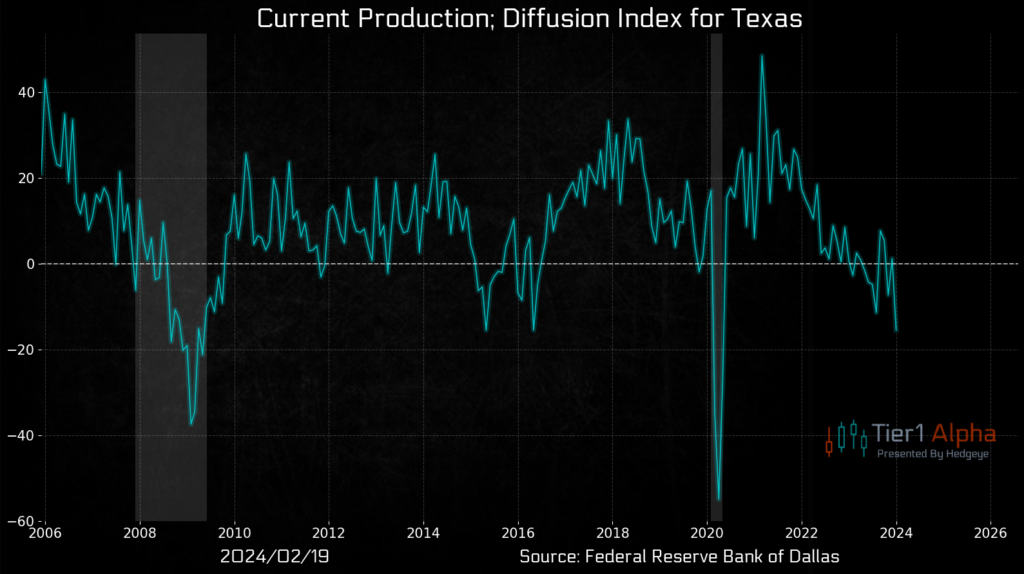
Current Production; Diffusion Index For Texas

The U.S. PMI is expected to rise above 50 on Thursday, marking an improvement after being below 50 (indicating contraction) since November 2022.
Today’s highlight is the Dallas manufacturing survey, underscoring Texas’s significance due to manufacturing comprising 11.2% of the state’s GDP, with the average manufacturing job paying over $95k and nearly a million jobs in the sector. Texas has been the leading export state in the U.S. for two decades. Could we witness a rebound similar to the one observed in the NY survey? Dallas Fed manufacturing has been in decline since April 2022!
As we anticipate the February data, the Dallas Fed’s general business activity index for Texas manufacturing dropped 17 points to -27.4 in January 2024, reaching an eight-month low and indicating a deeper contraction. The production index, a critical indicator of state manufacturing conditions, fell 17 points to -15.4, its lowest since mid-2020. The new orders index decreased slightly from -10.1 to -12.5 in January, while the growth rate of orders index, though still negative, improved eight points to -14.4. The capacity utilization index hit a multiyear low of -14.9, and the shipments index declined 11 points to -16.6.
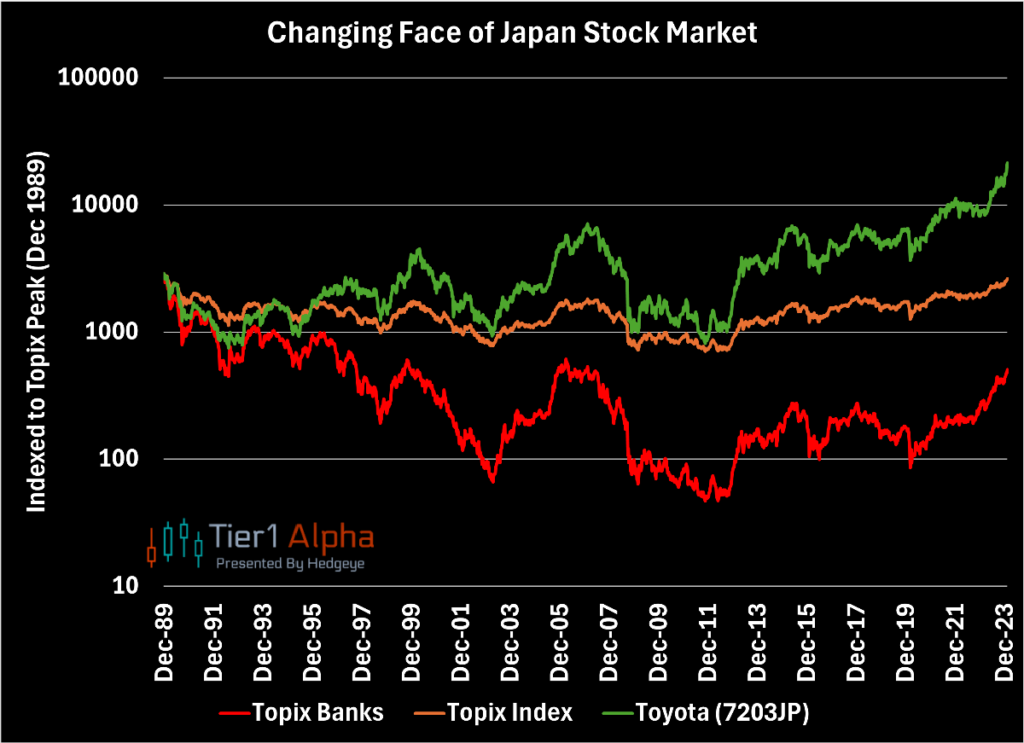
Changing Face Of Japan Stock Market

Overseas, Japan took out its 1989 high on the Nikkei. The broader Topix remains ~5% below the all-time peak, but it appears destined to make new highs as well. It is often remarked that “the rest of the world is following Japan” as it was the first country to age, among the first to experience negative population pressures, and arguably the first to suffer from the rise of China. With China’s star dimming, it’s fascinating to watch Japan’s resurgence. In another nod to “following Japan”, the character of the market has shifted radically over the last 34 years. In 1989, the Japanese stock market was dominated by banks. 34 years later, the bank index remains 80% lower while industrial and consumer focused names like Toyota and Fast Retailing (Uniqlo) have powered the recovery. Just a reminder that even in today’s world it’s a market of stocks.
